Robin R. White,*1 Tyler McGill,* Rebecca Garnett,* Robert J. Patterson,† and Mark D. Hanigan* *Department of Dairy Science, Virginia Tech, Blacksburg 24060 †Papillon Agricultural Company, Easton, MD 21601
Abstract
The objective of this work was to evaluate the precision and accuracy of the milk yield predictions made by the PREP10 model in comparison to those from the National Research Council (NRC) Nutrient Requirements of Dairy Cattle. The PREP10 model is a ration-balancing system that allows protein use efficiency to vary with production level. The model also has advanced AA supply and requirement calculations that enable estimation of AA-allowable milk (MilkAA) based on 10 essential AA. A literature data set of 374 treatment means was collected and used to quantitatively evaluate the estimates of protein-allowable milk (MilkMP) and energy-allowable milk yields from the NRC and PREP10 models. The PREP10 MilkAA prediction was also evaluated, as were both models’ estimates of milk based on the most-limiting nutrient or the mean of the estimated milk yields. For most milk estimates compared, the PREP10 model had reduced root mean squared prediction error (RMSPE), improved concordance correlation coefficient, and reduced mean and slope bias in comparison to the NRC model. In particular, utilizing the variable protein use efficiency for milk production notably improved the milk was constant whereas MP use was variable. Future work evaluating variable AA use efficiencies for milk production is likely to improve accuracy and precision of models of allowable milk.
Key words: Nutrient Requirements of Dairy Cattle, PREP10, amino acid efficiency
Short Communication
The PREP10 Dairy Model for Amino Acids is a modeling effort undertaken by the Papillon Agricultural Company (Easton, MD). Although the energy module of the PREP10 model is similar to other frameworks, the protein system differs substantially from the Nutrient Requirements of Dairy Cattle (NRC, 2001) model. In particular, PREP10 allows MP use efficiency to vary with production level scaled to BW, whereas NRC (2001) assumed a constant efficiency of protein use for lactation (67%). Specifically, PREP10 estimates MP use efficiency as proportional to targeted milk protein production per unit of BW, where high-producing cows have improved protein use efficiency:
MP use efficiency, kg/kg = 0.27 + 2.0 × (target milk true protein/BW0.53), [1]
where MP use efficiency is the efficiency of MP use for milk protein synthesis, target milk true protein is the user targeted milk true protein yield (kg), and BW is the cow body weight (kg).
Supply of MP in PREP10 is estimated as the sum of digestible RUP, digestible rumen-escaped RDP, and microbial MP. The system differs from NRC (2001) because it accounts for efflux of protein from the rumen in the fluid fraction as a proportion of MP supply, whereas NRC (2001) assumes only a portion of the B fraction protein and all of the C fraction protein contribute to RUP. Accounting for fluid associated protein efflux in PREP10 is similar to the approach taken by the Cornell Net Carbohydrate and Protein System (Van Amburgh et al., 2015). An additional difference between the NRC (2001) model and PREP10 is that PREP10 assumes both RUP and rumen escaped RDP are 80% digestible; NRC (2001) assumes feed-specific RUP digestibility fractions. The PREP10 RUP and ruminally escaped RDP contributions to MP are estimated based on feed protein fractions (A1, A2, B1, B2, and C), which are sourced from the PREP10 feed library. An additional discrepancy between the 2 models is that PREP10 does not include endogenous protein as a component of MP supply, whereas NRC (2001) does. Despite not including endogenous protein, these differences collectively result in greater MP supply predicted by PREP10 than by NRC (2001).
The requirement systems used by PREP10 and NRC (2001) also differ. As discussed, PREP10 estimates requirements for lactation based on a variable MP use efficiency for lactation, whereas NRC (2001) assumes a constant efficiency. Maintenance requirements also differ: PREP10 assumes maintenance costs of 0.132 g of MP/kg of BW and NRC (2001) estimated maintenance factorially based on losses in feces, urine, and scurf (with an average closer to 1.16 g of MP/kg of BW before adding requirements for endogenous flow). The substantial difference in the magnitude of the maintenance requirement is one reason why the numerical values of MP use efficiency for lactation in PREP10 were substantially lower than those used in NRC (2001).
Another unique attribute of PREP10 is the handling of AA. The NRC (2001) model predicts EAA supplies, but only suggests requirements for Met and Lys. PREP10 uses 3 partitions of AA for each ingredient to predict AA supplied by that ingredient: (1) AA in the ingredient (undifferentiated based on degradation); (2) RUP-associated AA in the ingredient; and (3) RDP-associated AA in the ingredient. The RUP AA estimates included in the PREP10 feed library are available for all feed ingredients and were based on AA residue data from 16-h in situ incubations conducted in lactating cows. The RDP AA is estimated as
RDP AA = TAA − RUP AA, [2]
where RDP AA is a percent of feed DM, TAA is total AA in the feed (% DM), and RUP AA is the feed RUP AA (% CP) from in situ incubation. Using these feed fractions, total metabolizable AA (MAA) is estimated for each ingredient as
MAA = RUP AA + microbial AA, [3]
where RUP AA (g/d; metabolizable RUP AA) and microbial AA (g/d; metabolizable microbial AA) are estimated as described in Equations 4 and 5.
Microbial metabolizable AA contributions to AA supply are calculated and added to the AA supplied by each ingredient to calculate total AA supply:
Microbial AA = AA profile × bacterial MP, [4]
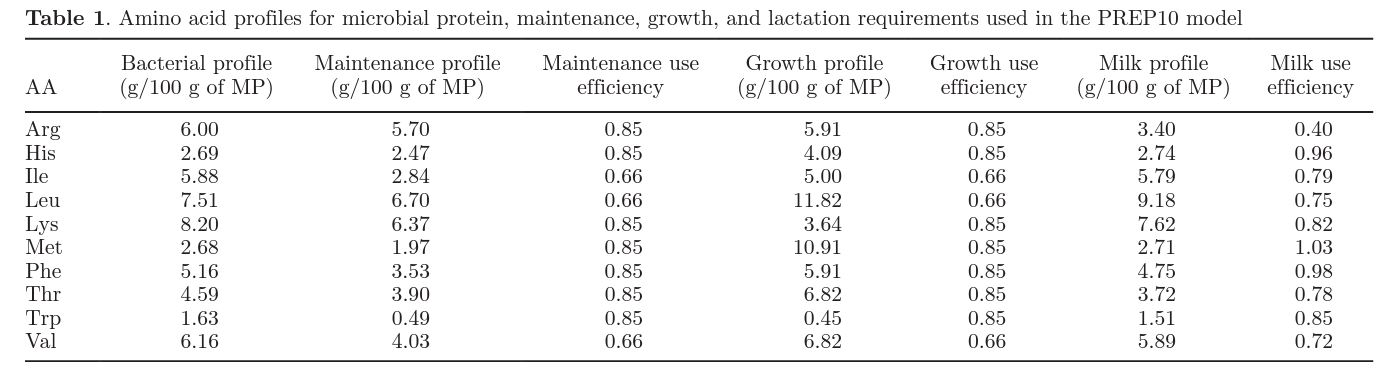
where microbial AA (g/d) is the total quantity of metabolizable microbial AA, AA profile is the proportion of each AA in bacteria (g/g), and bacterial MP (g/d) is the metabolizable protein contribution from microbes. The bacteria AA profile assumed is included in Table 1 and was based on a profile measured from over 400 samples of bacteria isolated from rumen digesta of nonlactating mature cows analyzed in the USDA laboratory at Beltsville, Maryland (Clark et al., 1992). Microbial MP is estimated as 52.9 g of bacterial MP/ kg of DMI plus contributions of fermentable starch and sugar to MP. If diet sugar is greater than 3% of DM, the MP contribution from sugar is assumed to be 160.6 g of bacterial MP/kg of sugar intake above 3% of DM. Similarly, if diet starch is greater than 25% of DM, MP contribution from starch is 94.6 g of bacterial MP/kg of starch intake above 25% of DM.
The metabolizable RUP AA (g/d) is estimated as
RUP AA (g/d) = RUP AA (%) × (RUP A2 + RUP B1 + RUP B2) + RDP escape, [5]
where RUP AA (g/d) is the total quantity of RUP AA from the feed, RUP AA (%) is the RUP AA estimate from the feed library (based on in situ incubation), RUP A2, B1, and B2 values reflect the soluble and partially degradable protein fractions from the feed library, and RDP escape is calculated in Equation 7. The RUP AA contributions are estimated based on a 5-pool protein system. The RUP fractions are calculated as
Fractionx RUP (% DM) = Fractionx × [feed passage rate/(feed passage rate + Fractionx solubility constant)], [6]
where the equation is replicated for each of the 5 protein fractions (x), feed passage rates are estimated following NRC (2001), and the solubility constants are sourced from the PREP10 feed library. Escape of liquid fraction protein is estimated as
RDP escape = [(A2 + B1 + B2 + C) − (A2 RUP + B1 RUP + B2 RUP)] × [liquid passage/ (liquid passage + rate constant for liquid)], [7]
where the liquid passage rate is estimated from NRC (2001) and the rate constant for liquid is also sourced from the PREP10 feed library. The model assumes no A1 fraction protein escapes the rumen.
Requirements for maintenance, growth, and lactation are estimated based on AA profiles of use for these functions and AA efficiencies. These profiles and efficiencies are listed in Table 1. Milk yield, BW, feed intake, and diet composition are used to estimate microbial AA contributions and AA requirements for maintenance, growth, and lactation. Microbial AA contributions are subtracted from AA required and the ratio of AA remaining to AA required is used to determine the AA in lowest supply.
PREP10 adheres to the principle of most-limiting AA. For each AA, the difference between supply and requirement is calculated. Milk production is then assumed to be equal to the production level allowed by the AA, which has the lowest supply relative to its requirement. Using the same approach as NRC (2001) allowable milk estimates, the AA-allowable milk is calculated as the ratio of AA supply to AA requirement multiplied by the target milk yield. Because a target milk is used in estimating the requirements of both systems, the target milk value cancels and does not affect the prediction output. The minimum of these estimated AA-allowable milk values is used, following the assumption that only 1 AA will limit milk production at a time.
To determine how these unique calculation features affect the milk production rates predicted by PREP10, the model was evaluated against a literature data set. The NRC (2001) model was also evaluated against this data set, thus allowing a direct comparison of the 2 models. Both models’ predictions of energy-allowable milk (MilkME) and protein-allowable milk (MilkMP) were assessed and the PREP10 model AA-allowable milk (MilkAA) prediction was also evaluated.
In many literature-based assessments of ration-formulation systems or performance models, feed library nutrient composition data are corrected to better match reported dietary nutrient composition from each study (Hanigan et al., 2013). In this analysis, we used literature reported, feed-specific chemical composition if it was available, but did not correct feed library values to match dietary nutrient composition when feed-specific data were not available. This was done because we were evaluating the ability of the 2 ration-formulation systems in their entirely. Thus, this analysis is as much a comparison of the adequacy of the feed libraries of these models as it is an analysis of their equations.
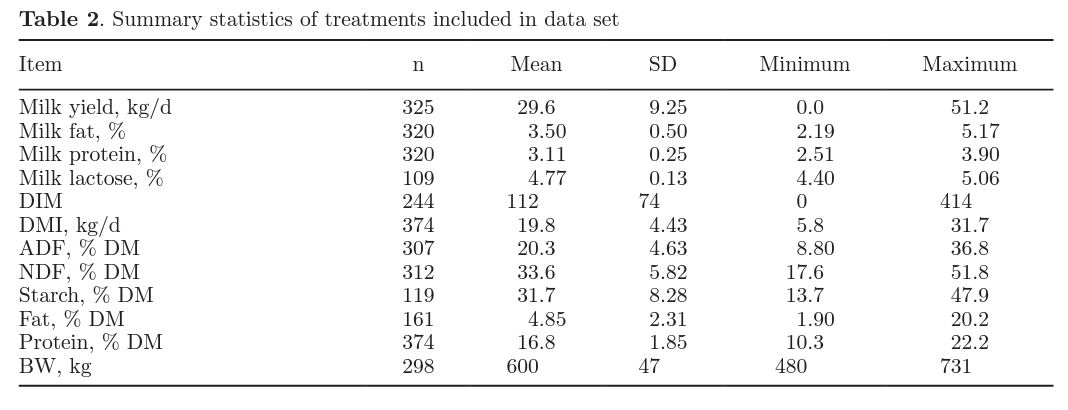
Data were collected from the original set of papers used to evaluate the NRC (2001) dairy model. This collection of papers was updated with more recent work published before 2012. Studies were included in the data set if they presented a numerical measurement of duodenal or omasal N flows. The final data set contained 374 treatment means, of which 325 reported milk yields and were used for this analysis. Table 2 presents a detailed summary of these data.
Most studies reported the inclusion rates of the ingredients used in diets; however, few studies (<10%) reported nutrient composition of all ingredients. When ingredient nutrient composition data were available, they were used to calculate dietary nutrient provision. When ingredient-level data were not available, data were populated from the NRC (2001) feed table for the NRC model and from the PREP10 feed library for the PREP10 model. As noted in Table 2, fatty acid, NDF, ADF, DM, and CP of diets were reported in 161 to 374 treatments.
For each treatment, ingredient inclusion rates and nutrient composition information were combined with reported animal characteristics and performance level and used as inputs to the PREP10 and NRC (2001) models. Estimated MilkME and MilkMP were recorded for the PREP10 and NRC (2001) models, and MilkAA was recorded for the PREP10 model. A most-limiting allowable milk (Milkmin) was calculated as the minimum of MilkME, MilkMP, and MilkAA for any given treatment. To compare a most-limiting framework with an empirical and simplistic representation of a co-limiting framework, a mean allowable milk (Milkmean) was calculated as the mean of MilkME, MilkMP, and MilkAA. Each milk yield estimate was compared with the measured milk yield for each diet. Milk estimates from both models were transposed into R statistical software (R Core Team, 2014) for comparison. Equation systems were compared using the root mean squared error of prediction (RMSPE), the mean bias, slope bias, and residual error as a percentage of the mean squared error of prediction (Bibby and Toutenburg, 1977), and Lin’s concordance correlation coefficient (Lin, 1989).
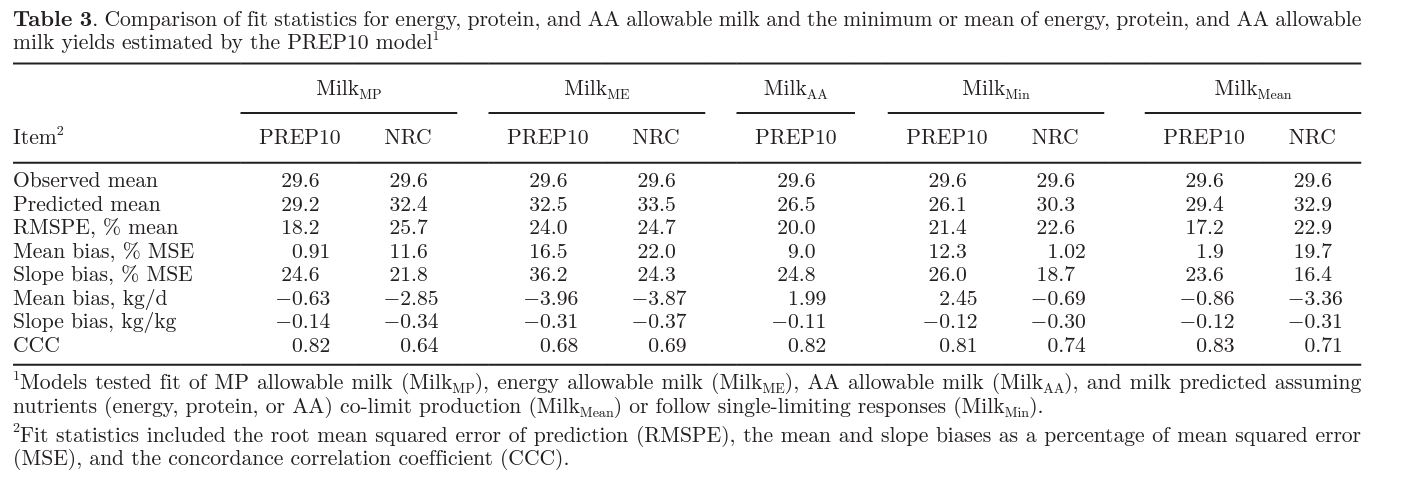
A unique attribute of the PREP10 model is the variable protein use efficiency estimate. Protein use efficiency declines as production level increases (Hanigan et al., 1998; Doepel et al., 2004). Although NRC (2001) uses a constant protein use efficiency (67%), the PREP10 model increases protein use efficiency as target protein production level increases. Accounting for this efficiency improved model precision and accuracy compared with NRC (2001; Table 3). Assuming a constant efficiency when efficiency should be variable contributes to slope bias. Although the NRC (2001) model had a lower contribution of slope bias to MilkMP RMSPE than the PREP10 model, the numeric slope bias of the PREP10 model was only 40% [−0.34 kg/ kg in NRC (2001) vs. −0.14 kg/kg in PREP10; Table 3] of the slope bias from NRC (2001). Based on previous studies, the 67% efficiency used in the NRC (2001) model likely overestimates conversion of MP into milk protein at high supply (Hanigan et al., 1998; Doepel et al., 2004), and potentially underestimates efficiency at low supply. In our data set, diets averaged 16.8% CP; therefore, it is likely that efficiency observed in the studies was less than 67%. This overestimation of efficiency is reflected in the larger mean bias (−2.85 vs. −0.63 kg; Table 3) in the NRC (2001) model compared with PREP10.
The PREP10 model predictions of MilkAA and MilkMP showed similar precision and accuracy (Table 3); however, MilkAA had a slight mean bias and higher RMSPE than MilkMP. Biologically, MilkAA should be a better representation of milk production than MilkMP, and the lack of improvement shown here was surprising. At the cellular level, signaling responses and protein synthesis mechanisms appear to respond independently to AA (Arriola Apelo et al., 2014a,b). Regulation of uptake of AA into the mammary gland depends on AA, but can be related to milk demand, arterial supply, and blood flow (Bequette et al., 1996). Given that cellular- and organ-level data clearly show that protein synthesis is dependent on the supply of multiple EAA, it is logical to expect a model accounting for multiple EAA to perform better when predicting milk yield than a model based on MP in aggregate. Two potential reasons explain why the MilkAA model failed to perform better than the MilkMP model: (1) the model considers static AA-use efficiencies and these values should be variable, such as the MP use efficiency; and (2) the model assumes 1 AA is most limiting when experimental evidence demonstrates that multiple AA can be limiting at one time (Giallongo et al., 2016). Addressing the first issue (variable AA use efficiency) is challenging without dose-response data on each AA. As such, reevaluating the single-limiting AA assumption may be a more efficiency strategy until such data becomes available.
The idea that a single AA is most limiting to milk production has been assumed to best represent the process for 70 yr (Block and Mitchell, 1946). However, simultaneous independent milk protein responses to multiple individual AA strongly suggest that the Block and Mitchell (1946) representation is not a good approximation of the process (Giallongo et al., 2016). It is possible that the lack of improvement in PREP10 MilkAA estimates when compared with MilkMP is further evidence that a most-limiting AA framework does not match well to measured biological responses.
The contribution of slope bias in the PREP10 MilkAA and MilkMP models was nearly identical (Table 3; 24.8 vs. 24.6%); however, MilkAA had a much larger mean bias (Table 3; 9 vs. <1%). Mathematically, taking a minimum (as is done when estimating minimum AAallowable milk) will always result in the smallest available value, and often this results in model underestimation of biological measurements. This is seen in the PREP10 MilkAA evaluation as a 2-kg underprediction of allowable milk. Modeling independent, additive effects of AA may help to advance efforts to more accurately represent the effects of AA on milk production. As such, future iterations of the PREP10 and NRC models should consider adopting a co-limiting nutrient framework, rather than a most-limiting nutrient framework.
Most dairy nutrition models employ distinct energy and protein systems that result in independent predictions of MilkME and MilkMP. Evaluation of Milkmin and Milkmean represent 2 approaches to integrating energy and protein in ration-formulation systems. Whereas Milkmin represents a most-limiting nutrient framework (either energy or protein is limiting), Milkmean represents more of a co-limiting framework (both energy and protein could limit production). Estimates from PREP10 suggest that a co-limiting model of milk production may better represent measured milk production than a most-limiting model (Table 3). The improvement in milk production prediction was expected because the cow synthesizes milk protein based on an integration of energy and AA supplies (Arriola Apelo et al., 2014b). In the case of the PREP10 model, the improved representation of milk yield by Milkmean may be due to the integrated nature of AA and energy effects on milk yield. Although similar in fit to NRC (2001), the PREP10 estimate of MilkME had poor precision and accuracy and overestimated milk yield on average (mean bias of −3.96 kg/d; Table 3). This is perhaps not surprising, as the modeling effort was clearly focused on the protein and AA systems. Another potential reason for the poor MilkME prediction would be the lack of BW or BCS change data in the literature. When BW or BCS change were not reported, a net change of 0 was used to calculate energy balance in both PREP10 and NRC (2001). This assumption of 0 BW or BCS change may have biased the energy balance calculations. More thorough reporting of BW or BCS change in future studies would help alleviate this issue. Although MilkME was overpredicted by both models, the MilkAA prediction substantially underpredicted production (mean bias of 1.99 kg/d; Table 3). If the 2 processes are indeed integrative, then one may expect an averaging approach to better represent that mechanism than basing the predictions solely on the minimum of each process.
Interestingly, MilkMP performed approximately as well as Milkmean. Given the theorized benefits of a colimiting nutrient model, this similarity in performance was unexpected. A potential explanation for the minimal difference is that MilkMP contains elements that are already energy limited, such as microbial protein. Perhaps this systematic integration of energy elements into the MilkMP equations provides similar benefits to the Milkmean approach. Given the discrepancy in results, future work is required to better explain whether a most-limiting or a co-limiting framework best represents dairy cattle milk production.
In nearly every calculation scenario (MilkMP, MilkME, MilkMin, MilkMean) the PREP10 model provided milk production estimates that had reduced slope bias and improved RMSPE and concordance correlation coefficient compared with the NRC (2001). Accounting for a variable protein use efficiency in the PREP10 model is a notable advantage that was reinforced by the precision and accuracy of the MilkMP estimates. Although the current prediction of MilkAA was not advantageous in terms of precision and accuracy, predicting MP use efficiency based on AA profile makes sense biologically and future work should center on advancing the PREP10 representation of MilkAA to understand why the current representation did not improve fit.
Acknowledgements
This work was supported by Papillon Agricultural Company (Easton, MD). The authors also acknowledge the contributions of the late L. F. Reutzel (Land O’ Lakes/Purina Mills, St. Louis, MO) for contributions to the initial code used in the project and the late Gale Bateman (Akey, Lewisburg, OH) for help in assembling and collating the diet ingredient data.
References
Arriola Apelo, S. I., J. R. Knapp, and M. D. Hanigan. 2014a. Invited review: Current representation and future trends of predicting amino acid utilization in the lactating dairy cow. J. Dairy Sci. 97:4000–4017.
Arriola Apelo, S. I., L. M. Singer, W. K. Ray, R. F. Helm, X. Y. Lin, M. L. McGilliard, N. R. St-Pierre, and M. D. Hanigan. 2014b. Casein synthesis is independently and additively related to individual essential amino acid supply. J. Dairy Sci. 97:2998–3005.
Bequette, B. J., F. R. C. Backwell, J. C. MacRae, G. E. Lobley, L. A. Crompton, J. A. Metcalf, and J. D. Sutton. 1996. Effect of intravenous amino acid infusion on leucine oxidation across the mammary gland of the lactating goat. J. Dairy Sci. 79:2217–2224.
Bibby, J., and H. Toutenburg. 1977. Prediction and Improved Estimation in Linear Models. Wiley, Hoboken, NJ.
Block, R. J., and H. H. Mitchell. 1946. The correlation of the amino acid composition of proteins with their nutritive value. Nutr. Abstr. Rev. 16:249–278.
Clark, J. H., T. H. Klusmeyer, and M. R. Cameron. 1992. Microbial protein synthesis and flows of nitrogen fractions to the duodenum of dairy cows. J. Dairy Sci. 75:2304–2323.
Doepel, L., D. Pacheco, J. J. Kennelly, M. D. Hanigan, I. F. López, and H. Lapierre. 2004. Milk protein synthesis as a function of amino acid supply. J. Dairy Sci. 87:1279–1297.
Giallongo, F., M. T. Harper, J. Oh, J. C. Lopes, H. Lapierre, R. A. Patton, C. Parys, I. Shinzato, and A. N. Hristov. 2016. Effects of rumen-protected methionine, lysine, and histidine on lactation performance of dairy cows. J. Dairy Sci. 99:4437–4452.
Hanigan, M. D., J. A. D. R. N. Appuhamy, and P. Gregorini. 2013. Revised digestive parameter estimates for the Molly cow model. J. Dairy Sci. 96:3867–3885.
Hanigan, M. D., J. P. Cant, D. C. Weakley, and J. L. Beckett. 1998. An evaluation of postabsorptive protein and amino acid metabolism in the lactating dairy cow. J. Dairy Sci. 81:3385–3401.
Lin, L. I. 1989. A concordance correlation coefficient to evaluate reproducibility. Biometrics 45:255–268.
NRC. 2001. Nutrient Requirements of Dairy Cattle. 7th ed. Natl. Acad. Press, Washington, DC.
R Core Team. 2014. R: A language and environment for statistical computing. R Foundation for Statistical Computing, Vienna, Austria. http://www.R-project.org/.
Van Amburgh, M. E., E. A. Collao-Saenz, R. J. Higgs, D. A. Ross, E. B. Recktenwald, E. Raffrenato, L. E. Chase, T. R. Overton, J. K. Mills, and A. Foskolos. 2015. The Cornell Net Carbohydrate and Protein System: Updates to the model and evaluation of version 6.5. J. Dairy Sci. 98:6361–6380.
Received May 9, 2016.
Accepted December 7, 2016.
1 Corresponding author: rrwhite@exchange.vt.edu
Originally published in Journal of Dairy Science Vol. 100 No. 4, 2017.